Or how to unlock the reliability of your data assets at any stage of the pipeline
By Salma Bakouk, co-written with Benedetta Cittadin
Over the past decade, data-driven decision-making has proven to be instrumental in any modern organization’s growth stage. As a result, modern data environments are constantly evolving and becoming more and more complex. This surge in the complexity of the Modern Data Stack is responsible for adding more unpredictability and risk of failure to data pipelines. The idea of “garbage in, garbage out” still applies to today’s data environments, however, as data issues can happen at any stage of the pipeline, the concept is no longer sufficient to deal with data quality issues efficiently. Data issues can occur at any stage, from ingestion through storage and processing to BI tools. This can make the process of turning data into actionable insights slow and expensive, causing organizations to make compromises on their data. Making compromises on data quality and data governance, however, is dangerous for organizations for many reasons:
- Data accessibility is crucial, and while real-time data streams are becoming increasingly popular, documentation is hindered.
- With data becoming more available, the number of data sources a business relies on increases exponentially. This can complexify the data processing further and jeopardize the quality of data, especially when the sources are external.
- As the data stack grows, so does the Modern Data Team. This presents a great opportunity and a challenge to address, as more people working with data means more risk of changes to data that can decrease data quality. Data democratization initiatives are likely to fail without proper data governance.
In general, more data means you have a better shot at understanding and differentiating your business. But more data also means more risks of data failures and, hence, decreased data quality, bad business decision-making, and consequently erosion of data trust. Fortunately, in the past few years, a new approach to dealing with data quality, trust, and reliability has emerged: data observability.
The aim of this blog is to introduce the concept of Data Observability and spell out why organizations need to integrate a Full Data Stack Observability tool into their data stack. We’ll do so by answering the following questions:
- What is data observability?
- Data observability vs. testing and data quality monitoring — What’s the difference?
- Full Data Stack Observability — What does it mean?
- What are the most powerful applications of full data stack observability?
1. What is Data Observability?
Originally borrowed from control theory, software engineering adopted the term “observability” before spreading to the data world. The first software observability tools rose from the foundation laid by cloud services like AWS. Software observability tools like Datadog and New Relic gave engineering teams the ability to collect metrics across their systems to provide them with a complete understanding of the health status of these systems. The premise behind software observability is very straightforward: as the cloud allows to host more and more infrastructure components — such as databases, servers, and API endpoints — it becomes crucial to carefully monitor this complex infrastructure to know when something goes wrong. Today, software engineers cannot imagine not having a centralized view across their systems. Software observability tools have radically transformed the world of software, putting the importance of visibility across all systems front and center.
The data space is currently going through the same revolution. As mentioned in the introduction, the set of tools that data teams use is growing and becoming more and more complex, increasing the opportunity for data to break and making it more challenging to gain visibility into different parts of the data pipeline. These problems have become prevalent in organizations, and data users are unsatisfied with data quality.
In short, the emerging category of data observability aims to solve the following problems: monitoring data to quickly assess where issues might have happened to give teams the context to solve them promptly. Data Observability can therefore be defined as the ability of organizations to gain actionable insights regarding the health status of their data.
Although Data Observability originated in Software Observability, there are some significant differences to keep in mind. Software Observability is built on three pillars: Metrics, Traces, and Logs
These pillars, however, don’t quite match the critical aspects that constitute the workflow of Data Engineering. A new framework need to be introduced to capture all the complexities of Data and Data Infrastructure, we suggest:
- Metrics: measure the quality of the data.
- Metadata: have access to data about the data.
- Lineage: know the dependencies between data assets.
The three pillars are discussed in more depth later in this blog.
2. Data observability vs. testing and data quality monitoring — What’s the difference?
Data engineers often use tests to detect and prevent potential data quality issues. This approach worked fine until companies started consuming so much data that testing wasn’t enough anymore. Testing has become inefficient because data quality issues have become harder to detect and predict. Although teams have hundreds of tests to cover the predictable data issues, they are yet to cover all the infinite possibilities for data breaking throughout the entire pipeline or have the context to understand the data issues and learn from them, leaving them in a constant state of firefighting. On the other hand, Observability is scalable, delivers end-to-end coverage, and provides the context needed (thanks to lineage) to get ahead of data catastrophes and become proactive about DQ.
Data observability and data quality monitoring are often used interchangeably, but they are two different things. Or better, one enables the other. Data Observability enables data monitoring. Data quality monitoring alerts users when data assets or data sets don’t match the pre-established metrics or parameters. This process generates the same limitations as testing. Although you might gain some visibility over the quality status of your data assets and attributes in data quality monitoring, you have no way of knowing how to troubleshoot potential issues quickly.
So neither testing nor traditional data quality monitoring can deal with the challenges of the Modern Data Stack on their own. This is where data observability comes in.
Data observability constantly collects signals across the entire data stack — logs, jobs, datasets, pipelines, BI dashboards, data science models, etc. — enabling monitoring and anomaly detection at scale. In other words, Data Observability acts as an overseeing layer for the data stack, ensuring that the data is reliable and traceable at every stage of the pipeline and regardless of which processing point it resides.
3. Full Data Stack Observability — What does it mean?
Data Observability should be perceived as an overseeing layer to make your Modern Data Stack more proficient and ensure that data is reliable regardless of where it sits. We’ve created Sifflet — the first Full Data Stack Observability platform — to enable organizations to get automated data reliability at every step of the pipeline.
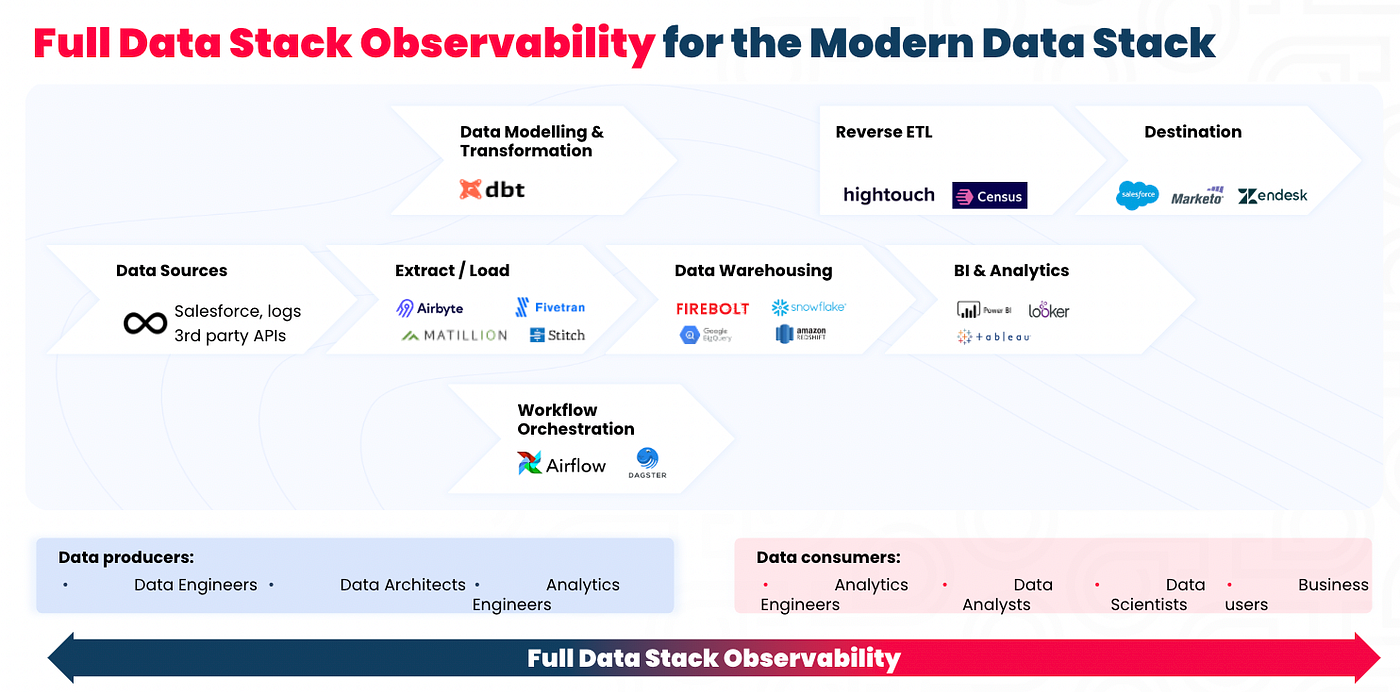
In the Full Data Stack Observability approach, each component of the Modern Data Stack is perceived as a compartment that serves a purpose in the data journey. The compartments have a logic to operate and release information that can be leveraged to understand and observe the metadata, the data itself, the lineage, and the resulting data objects (metrics, charts, dashboards, etc.). To this end, the extensive lineage between the data assets and the objects across the data stack is the backbone of the Full Data Stack Observability framework.
4. What are the most powerful applications of full data stack observability?
To add some context to this definition, let’s look at some of the most critical use cases for Full Data Stack Observability.
Anomaly detection: at both the metadata and the data level. The idea is to introduce a set of metrics that can help define the health state of a data platform. Some standard business agnostic metrics include:
- Freshness / Timeliness (Data metric): is the data up-to-date?
- Completeness / Volume (Metadata metric): are there missing values? Missing rows? Missing data records? Incomplete pipelines?
- Duplication (Data metric): are there any duplicates?
- Schema (Metadata metric): Did the structure of data change? Did a maintenance SQL query change something and is causing pipelines to break? Or are dashboards to become obsolete?
- Accuracy (Data metric), e.g., is data within a specific range? In a particular format? Etc.
Lineage: lineage represents the dependencies between the data assets within an organization. As data volumes grow and data platforms become more complex, keeping track of how one asset is related to another becomes impossible. But why is keeping track of the dependencies even relevant? Let’s look at a couple of scenarios that a data practitioner at your average data mature organization deals with daily:
- First, having access to downstream dependencies is critical to break silos within organizations. Imagine a company with a software engineering team and a data team that barely communicate with each other. The former may not even know how releasing a change could impact the data team. This barrier between teams can be broken through data lineage, in other words, through accessing the downstream dependencies of a team’s actions beyond the scope it covers.
- Second, lineage enables teams to get to the bottom of a data issue and solve it promptly. Imagine an organization struggling with keeping up with records and documentation due to its quick growth in the last few years. If a number doesn’t make sense in a dashboard, business leaders will quickly ask the data team to get to the root cause. What these business leaders sometimes fail to realize is that it can take hours, if not days, to get to the bottom of a data issue manually. This is where lineage comes into play. Access to upstream dependencies enables data teams to identify and troubleshoot a data issue before it becomes a business issue.
The following use cases are closely tied to the two above in the sense that they come as a result of the two aforementioned combined. In other words, say you have implemented an anomaly detection model that can also consume and produce lineage information. You receive an alert notifying you that something broke; what do you do?
Incident Management: I would say that the first thing you want to do is assess the impact of such an anomaly. What does it mean for the data consumers? What are its potential implications? What dashboards, charts, or ML models is it feeding into? Who else should be alerted? Extensive lineage with column detail helps answer these questions. Think of what Brian could’ve done to avoid the crisis.
Root Cause Analysis: Data engineers need to get to the bottom of the issue now that relevant stakeholders are aware of how their workflows are impacted. A decent lineage model will show you the upstream dependencies (left of the warehouse), so you can better understand where the problem stems from. A great lineage model will also link to applications, jobs, and orchestrators, resulting in the anomalous data asset. Jacob and his team would’ve been able to quickly understand the causing issue and rectify the numbers before the CEO’s press conference.
Post-Mortem: What happened, and how do we learn from it? Think of a data incident as a fire that can quickly spread and have both material and non-material repercussions. When you introduce testing and basic Data Quality monitoring, you are in fire fighting mode, but when you adopt a Full Data Stack Observability approach, you can learn how to identify fire hazards, how to stop the occasional fire, reduce the potential impacts of it and move from fire fighting to fire prevention. Conducting a purposeful post-mortem analysis is key to achieving sustainable health of data assets.
Conclusion — From fire fighting to fire prevention
The complexity of a data platform is no longer an excuse to justify poor data quality. Any modern leader should embrace this increasing complexity because it means that the business is growing and that there is more data to leverage. However, any great value that can be extracted from data is offset without proper tooling and processes in place.
Full Data Stack Observability is an overseeing layer of the data stack and ensures that data is reliable at every step of the enterprise data pipeline. Although Data Observability frameworks draw a lot of inspiration from Software Observability and APM, some fundamental differences called for industry-defining frameworks and practices over the past couple of years. A Full Data Stack Observability approach leverages a combination of metrics, ingestion to BI lineage, and metadata to provide data engineers and data consumers with actionable insights to monitor and reduce the impact of data incidents and actively increase the reliability of the data assets.
Disclaimer: I am the co-founder and CEO of Sifflet, a Full Data Stack Observability platform https://www.siffletdata.com/